submitted to 2018 IEEE International Symposium on Circuits & Systems (ISCAS)
- Sifeng Xia
sfxia18@163.com - Wenhan Yang
yangwenhan@pku.edu.cn - Jiaying Liu
liujiaying@pku.edu.cnExperimental Results
In this paper, the proposed method is compared with different SR methods including a typical learning-based SR method [1] (denoted as NE) and two online compensation methods (respectively denoted as Landmark [2] and GSSR [3]). For fair comparison, we add the retrieved HR reference images to the training set of learning-based method NE. Besides, the intermediate results derived by IHN [4] are also shown as the baseline. The baseline is one of the newest deep based SR methods without using external references. The testing images are chosen from the Oxford Building dataset [5]. There are totally 8 testing images named from (a) to (h) for comparison, as shown in the paper. There are 4 reference images for each image to be recovered.
Experiment 1:
Table. 1 shows the detailed objective results of different methods for each testing image.
Table 1. PSNR and SSIM values of different methods for each testing image.
Images NE [1] Landmark [2] GSSR [3] Baseline [4] Proposde Method 2 3 4 2 3 4 2 3 4 2 3 4 2 3 4 a 28.38 27.27 25.63 30.77 29.74 28.36 32.14 29.66 28.14 33.26 30.11 28.30 34.37 31.84 30.16 0.8596 0.8375 0.7916 0.9000 0.8723 0.8390 0.9291 0.8878 0.8461 0.9488 0.8974 0.8498 0.9597 0.9296 0.8992 b 27.00 25.89 24.23 28.71 27.69 26.45 29.73 27.80 26.49 30.83 28.00 26.68 31.57 29.04 27.69 0.8180 0.7903 0.7349 0.8475 0.8152 0.7780 0.8892 0.8396 0.7921 0.9174 0.8477 0.7982 0.9294 0.8772 0.8355 c 29.09 28.07 26.30 30.67 29.40 27.77 31.72 29.82 28.28 32.92 30.10 28.43 34.18 31.87 30.33 0.8233 0.7945 0.7397 0.8031 0.8232 0.7670 0.8936 0.8382 0.7758 0.9235 0.8480 0.7826 0.9319 0.8727 0.8094 d 26.99 26.08 24.47 28.72 28.25 26.43 28.63 26.85 25.81 29.52 27.07 25.83 31.40 29.30 27.83 0.7884 0.7560 0.6978 0.8539 0.7573 0.7569 0.8359 0.7774 0.7262 0.8731 0.7848 0.7287 0.9089 0.8435 0.7938 e 31.13 30.01 28.18 33.43 32.32 30.23 33.58 31.81 30.22 35.22 32.05 30.32 36.35 33.37 32.54 0.9311 0.9191 0.8937 0.9384 0.9240 0.9031 0.9535 0.9396 0.9190 0.9717 0.9453 0.9205 0.9745 0.9523 0.9335 f 28.83 27.76 25.91 31.11 29.94 28.34 31.74 29.56 27.89 33.21 30.14 28.37 34.05 31.36 29.47 0.8120 0.7895 0.7258 0.8640 0.8353 0.7912 0.8792 0.8258 0.7653 0.9134 0.8383 0.7765 0.9244 0.8706 0.8194 g 28.57 26.77 25.76 30.31 29.18 27.83 32.17 29.86 28.33 33.41 30.17 28.55 34.44 31.32 29.47 0.7859 0.7612 0.7012 0.8423 0.8080 0.7557 0.8847 0.8132 0.7496 0.9135 0.8225 0.7593 0.9316 0.8659 0.8118 h 27.19 26.11 24.41 29.52 27.92 26.29 31.37 28.20 26.35 32.07 28.18 26.35 32.89 29.35 27.34 0.7551 0.7176 0.6351 0.8329 0.7711 0.6994 0.8879 0.7991 0.7019 0.9174 0.8083 0.7115 0.9359 0.8614 0.7775 Avg. 28.40 27.25 25.61 30.41 29.31 27.71 31.39 29.20 27.69 32.56 29.48 27.85 33.66 30.93 29.35 0.8217 0.7957 0.7400 0.8603 0.8258 0.7863 0.8941 0.8401 0.7845 0.9224 0.8490 0.7909 0.9370 0.8842 0.8350 Gain 5.26 3.69 3.74 3.25 1.63 1.64 2.27 1.74 1.67 1.10 1.45 1.50 - - - 0.1154 0.0884 0.0950 0.0700 0.0508 0.0487 0.0429 0.0365 0.0505 0.0079 0.0351 0.0441 - - - Experiment 2:
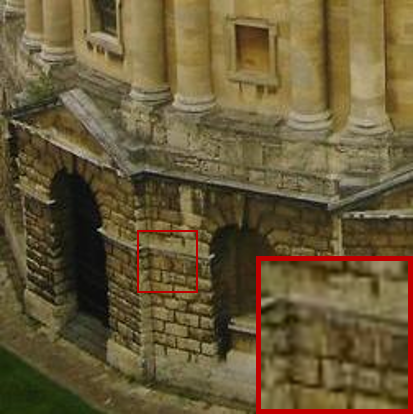
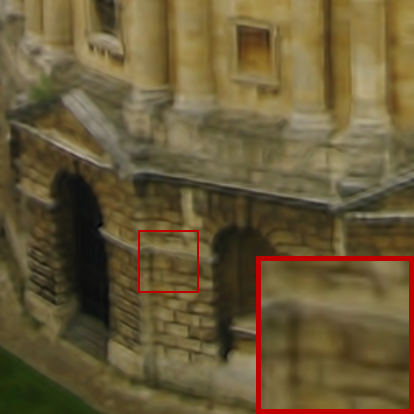
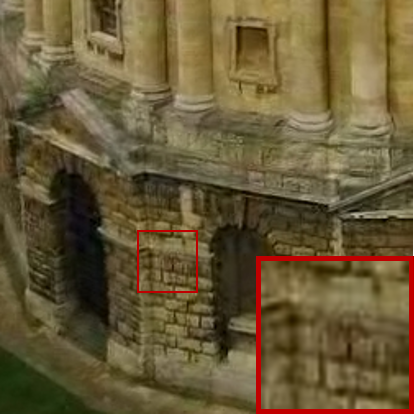
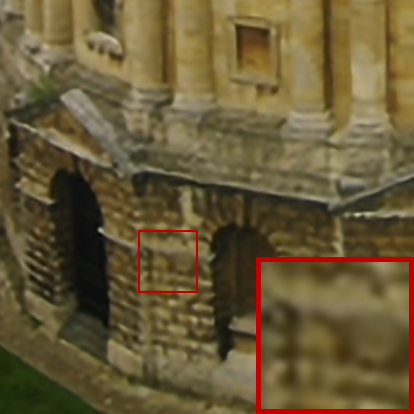
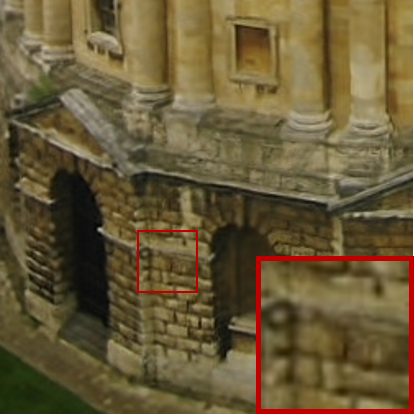
Some more subjective results with magnification factor 3 for the testing images are shown in Fig. 1~3.


(a) Ground Truth (b) NE [1] (c) Landmark [2] 


(d) GSSR [3] (e) Baseline [4] (f) Proposed Method
Fig.1 Subjective results of different methods for the testing image 'a'.
(a) Ground Truth (b) NE [1] (c) Landmark [2] 
(d) GSSR [3] (e) Baseline [4] (f) Proposed Method
Fig.2 Subjective results of different methods for the testing image 'c'.


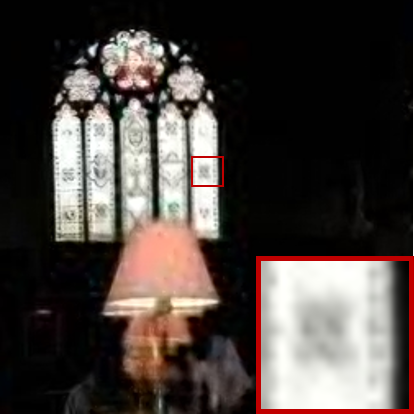
(a) Ground Truth (b) NE [1] (c) Landmark [2] 


(d) GSSR [3] (e) Baseline [4] (f) Proposed Method
Fig.3 Subjective results of different methods for the testing image 'e'.
References
[1] Y. Li, J. Liu, W. Yang, and Z. Guo, “Neighborhood regression for edgepreserving image super-resolution,” in Proc. IEEE Int’l Conf. Acoustics, Speech, and Signal Processing, 2015.
[2] H. Yue, X. Sun, J. Yang, and F. Wu, “Landmark image super-resolution by retrieving web images,” IEEE Transactions on Image Processing, vol. 22, no. 12, pp. 4865–4875, December 2013.
[3] J. Liu, W. Yang, X. Zhang, and Z. Guo, “Retrieval compensated group structured sparsity for image super-resolution,” IEEE Transactions on Multimedia, vol. 19, no. 2, pp. 302–316, 2017.
[4] W. Yang, J. Feng, J. Yang, F. Zhao, J. Liu, Z. Guo, and S. Yan, “Deep edge guided recurrent residual learning for image super-resolution,” IEEE Transactions on Image Processing, vol. 26, no. 12, pp. 5895 – 5907, 2017.