- Sijie Song
ssj940920@pku.edu.cn - Yanghao Li
lyttonhao@gmail.com - Jiaying Liu
liujiaying@pku.edu.cn - Zongming Guo
guozongming@pku.edu.cn
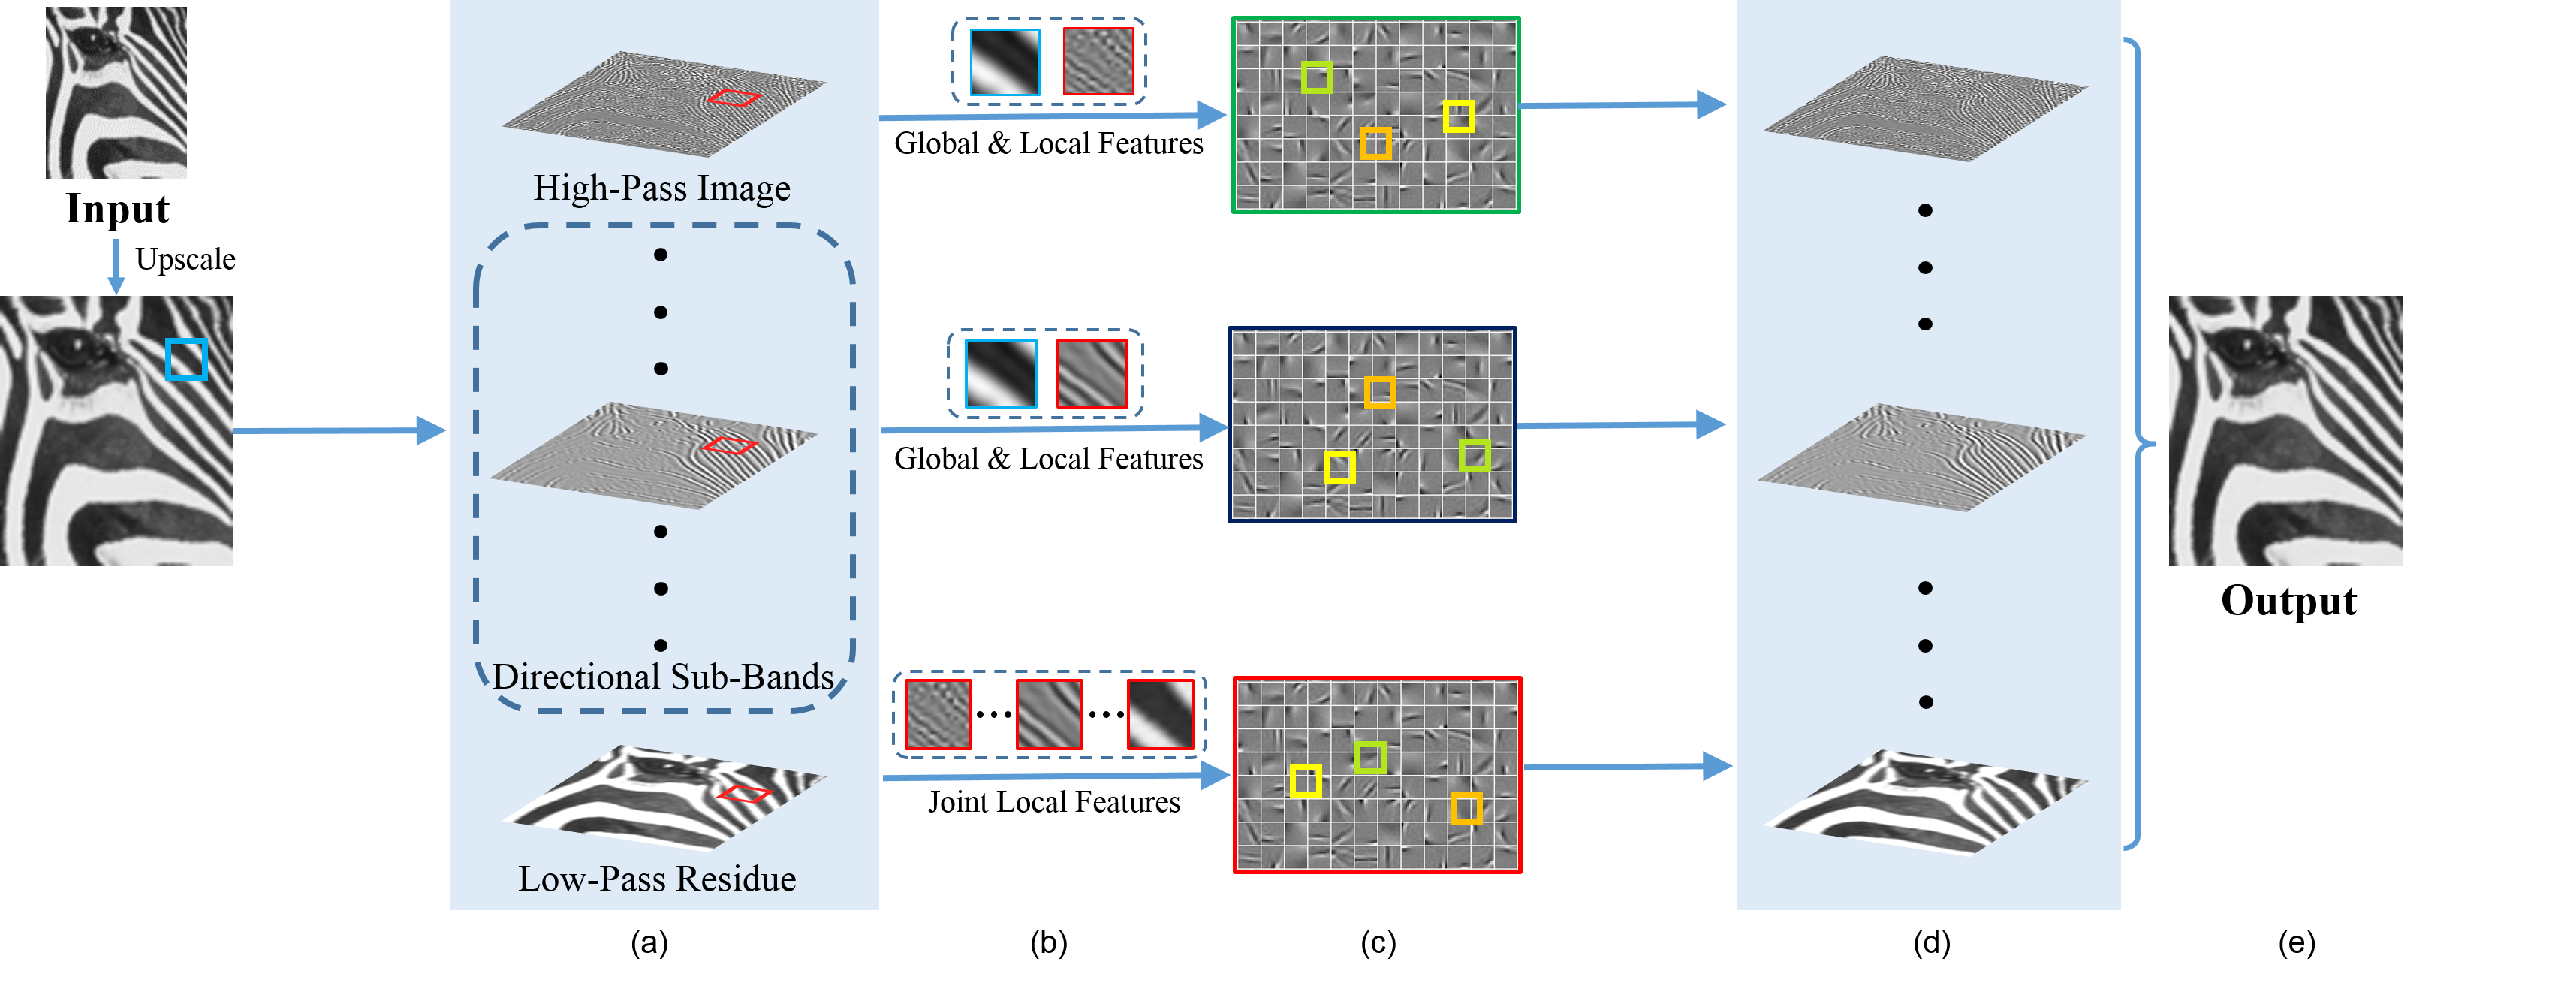
Fig.1. The framework of joint sub-band based neighbor embedding for image super-resolution. (a) Different frequency components obtained from steerable pyramid transform. (b) References for similar patches considering global and local features. (c) Nearest neighbors from external library. (d) Reconstruction based on neighborhood regression for each frequency component. (e) Super-resolved image through inverse steerable pyramid transform.
Abstract
In this paper, we propose a novel neighbor embedding method based on joint sub-bands for image super-resolution. Rather than directly reconstructing the total spatial variations of the input image, we restore each frequency component separately. The input LR image is decomposed into sub-bands defined by steerable filters to capture structural details on different directional frequency components. Then the neighbor embedding principle is employed to reconstruct each band, respectively. Moreover, taken the diverse characteristics of each band into account, we adopt adaptive similarity criterions for searching nearest neighbors. Finally, we recombine the generated HR sub-bands by applying the inverting sub-band decomposition to get the final super-resolved result. Experimental results demonstrate the effectiveness of our method both in objective and subjective qualities comparing with other state-of-the-art methods.
Implementation
Image Decomposition with Steerable Filters
The self-inverting and multi-orientation steerable pyramid transform at one scale is first employed to extract different frequency components from the input LR image. By computing the response of a set of steerable filters, we can obtain the direction selective sub-bands with N orientations, as well as the high-pass image and the residual low-pass information. The motivations we decompose the input image in frequency domain are twofold. (i) Structural patterns like edges are usually more prominent in one directional sub-band. Decomposing the image conveys such a property explicitly so that we are able to recover more details on this sub-band and get sharper edges in the final result. (ii) Richer textures can be synthesised because each frequency component is recovered independently. The combination of them can provide textures not existing in the training set. An example of decomposition result can be viewed below.
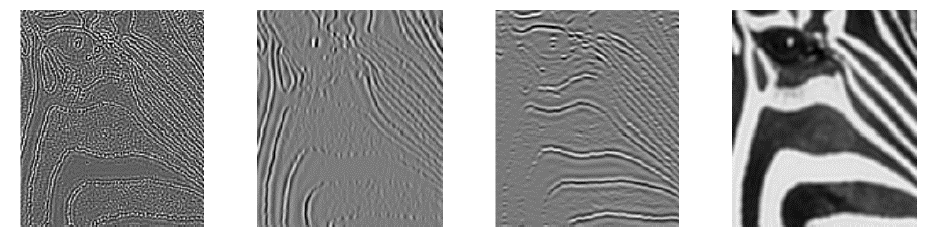
Fig.2. Representations of steerable pyramid transform with one scale and two orientations. From left to right: high-pass image, two directional sub-bands (vertical and horizontal, respectively ), and low-pass residue.
Simalarity Metrics with Global and Local Features
Each frequency band of the input LR image is reconstructed independently to generate the corresponding HR bands.However, the qualities of reconstructed patches rely heavily on their nearest neighbors. It is important to formulate good similarity criterions when performing retrieval algorithms.
For the high-pass image and sub-bands, we not only consider local features, but also introduce the global structural information from the bicubic interpolated image. Taken both the global and local features into consideration, we develop the distance function for the patch in reatrieval algorithm as follows:

And the comparision below illustrate the effectiveness of the similarity metrics for high-pass image and sub-bands.
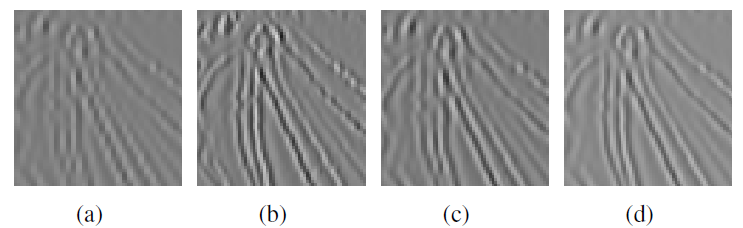
Fig.3. (a) Sub-band of upscaling image. (b) Corresponding sub-band of ground truth. (c) Results with only local features referred for similarity. (d) Results with global and local features referred for similarity.
The low-pass residue is more smooth due to its low frequency, which results in the difficulty extracting gradient features. But it is coherent and contains enough structural information. So for a patch from the low-pass image, we need joint local features from its corresponding patches of other bands. The similarity metric on patch can be given by:
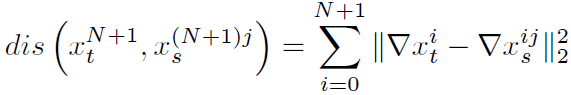
In the end, to generate the super-resolved result, the HR bands are combined through inverting the steerable pyramid decomposition. Besides, the nonlocal redundancy is also employed to the generated HR image to enhance the final result. For each patch, we seek its similar patches and constrain the prediction error to be minimum.
Experimental Results
In the experiment, to evaluate the effectiveness of the proposed method, we conduct experiments (x2) on several test sets (Set5, Set14 and B100) used in the previous literature. For a fair comparison, we also adopt the training set consisting of 91 images from ScSR [1]. The LR input images are generated from the original HR images by bicubic downsampling with the scaling factor. In our experiment, we decompose the image into the high-pass image, four directional sub-bands, as well as the low-pass residue. It is shown in the following tables that our proposed method performs better than other state-of-the-art methods.
Table 1. Average PSNR(dB) results of different super-resolution methods on test sets.
| Test Set | Bicubic | ScSR[1] | ANR[2] | BPJDL[3] | SRCNN[4] | NE | Proposed |
|---|---|---|---|---|---|---|---|
| Set5 | 33.68 | 36.00 | 35.84 | 36.20 | 36.34 | 35.84 | 36.59 |
| Set14 | 30.23 | 31.93 | 31.80 | 32.02 | 32.17 | 31.79 | 32.33 |
| B100 | 29.56 | 30.92 | 30.82 | 31.00 | 31.14 | 30.76 | 31.22 |
Table 2. PSNR(dB) results of different super-resolution methods on Set5.
| Set 5 | Bicubic | ScSR[1] | ANR[2] | BPJDL[3] | SRCNN[4] | NE | Proposed |
|---|---|---|---|---|---|---|---|
| baby | 37.09 | 38.37 | 38.44 | 38.63 | 38.30 | 38.12 | 38.56 |
| bird | 36.83 | 40.21 | 40.04 | 40.66 | 40.64 | 40.34 | 41.07 |
| butterfly | 27.44 | 30.99 | 30.48 | 30.96 | 32.13 | 30.75 | 32.27 |
| head | 34.88 | 35.68 | 35.66 | 35.76 | 35.64 | 35.49 | 35.72 |
| woman | 32.15 | 34.72 | 34.55 | 34.96 | 34.94 | 34.48 | 35.31 |
| average | 33.68 | 36.00 | 35.84 | 36.20 | 36.34 | 35.84 | 36.59 |
Table 3. PSNR(dB) results of different super-resolution methods on Set14.
| Set 14 | Bicubic | ScSR[1] | ANR[2] | BPJDL[3] | SRCNN[4] | NE | Proposed |
|---|---|---|---|---|---|---|---|
| baboon | 24.89 | 25.55 | 25.54 | 25.60 | 25.61 | 25.39 | 25.67 |
| barbara | 27.99 | 28.67 | 28.59 | 28.58 | 28.59 | 28.50 | 28.69 |
| bridge | 26.57 | 27.64 | 27.54 | 27.70 | 27.69 | 27.41 | 27.80 |
| coastguard | 29.12 | 30.62 | 30.44 | 30.61 | 30.49 | 30.26 | 30.63 |
| comic | 26.01 | 27.90 | 27.77 | 28.05 | 28.27 | 27.55 | 28.36 |
| face | 34.83 | 35.66 | 35.63 | 35.74 | 35.62 | 35.47 | 35.69 |
| flowers | 30.37 | 32.50 | 32.29 | 32.60 | 33.03 | 32.17 | 33.07 |
| foreman | 34.14 | 36.29 | 36.40 | 36.41 | 36.20 | 36.55 | 37.00 |
| lena | 34.70 | 36.36 | 36.40 | 36.54 | 36.50 | 36.21 | 36.64 |
| man | 29.24 | 30.57 | 30.47 | 30.67 | 30.82 | 30.44 | 30.89 |
| monarch | 32.93 | 36.11 | 35.71 | 36.21 | 37.17 | 35.89 | 37.26 |
| pepper | 34.96 | 36.50 | 36.39 | 36.55 | 36.75 | 36.77 | 37.04 |
| ppt3 | 26.87 | 29.28 | 28.97 | 29.47 | 30.39 | 29.39 | 30.13 |
| zebra | 30.63 | 33.30 | 33.07 | 33.49 | 33.28 | 33.08 | 33.79 |
| average | 30.23 | 31.93 | 31.80 | 32.02 | 32.17 | 31.79 | 32.33 |

Fig.4. Comparison of PSNR(dB) results by 2x on the (butterfly, comic) images: (a) Bicubic, (b) ScSR[1], (c) ANR[2], (d) BPJDL[3], (e) SRCNN[4], (f) NE, (g) Proposed. The red block with its corresponding magnification on the left-bottom corner of each image shows the reconstruction details.
References
[1] J. Yang, J. Wright, T. S. Huang, and Y. Ma, “Image super-resolution via sparse representation,” IEEE Transactions on Image Processing, vol. 19, no. 11, pp. 2861–2873, 2010.
[2] R. Timofte, V. De, and L. V. Gool, “Anchored neighborhood regression for fast example-based super-resolution,” in Proc. IEEE Int’l Conf. Computer Vision (ICCV), pp. 1920–1927, 2013.
[3] L. He, H. Qi, and R. Zaretzki, “Beta process joint dictionary learning for coupled feature spaces with application to single image super-resolution,” in Proc. IEEE Int’l Conf. Computer Vision and Pattern Recognition (CVPR), pp. 345–352, 2013.
[4] C. Dong, C. Loy, K. He, and X. Tang, “Image super-resolution using deep convolutional networks,” IEEE Transactions on Pattern Analysis and Machine Intelligence , vol. PP, no. 99, pp. 1–1, 2015.